Its not a Trump surge. Its a Democrat slump.

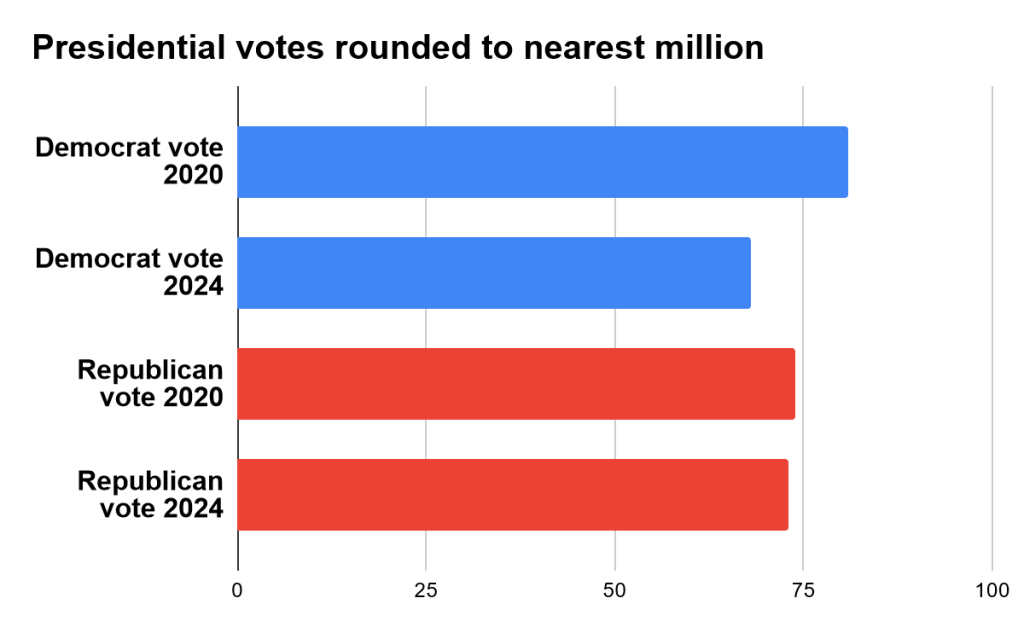
Correction: As of 14/11/24 Trump’s total vote is just under 76 million and Harris’s just under 73 million. That means Trump’s vote has risen by 2 million while the drop in Democrat support is around 8 million.

It is important to base analysis on facts not wishful thinking, so, once the final final count is in, I will rewrite this blog.

Nevertheless, the main argument remains valid.

A small increase in the Trump vote, perhaps 2% or so up on 2020, is not a surge, and remains a very thin mandate for the sweeping changes he intends to bring in. He is standing on thin ice and it is likley that the measures he will take will blow up in his face.

The drop in Democrat support, at around 10% of their 2020 vote, remains very large.

The media chatter about fundamental realignments in US politics has an air of the UK in 2019, but where is Boris Johnson now?

Between the 2020 election and the 2024 election, with nearly all votes now counted, Donald Trump’s vote FELL by a nearly a million, from 74.2 million to 73.4 million*. This is not the surge the media are reporting.

But, the Democrat vote slumped by 12 million, from 81 million to 69 million. So, this was more a Democrat defeat than a Trump victory.

In some ways it is a Republican victory despite Donald Trump.

As this was based on a squeeze on worker’s living standards with real wages lower now than when Biden was elected, and an anger and fear about the slide in US global standing (Biden first lost significant support at the time of the Afghanistan withdrawal) Trump will find that he is standing on thinner ice than the media are projecting because his economic policy of tax cuts for the rich and tariffs on imports will hit living standards even harder, mass deportations will spark mass anger, as will the devastation brought by wholesale environmental deregulation, not to mention the impacts of letting RFK loose on health.

With Republican control of the Senate, the House and the Supreme Court, there will be no checks and balances on this, so the madness will be able to run in full spate until at least the mid term elections in 2 years time. At which point, its likely that the reaction will be severe.

The decision of the Democrats to campaign on what might be called a “Red Wall” strategy,

  • trying to appeal to conservative leaning voters with conservative leaning policies on immigration,
  • having campaign sessions with Liz Cheney,
  • keeping quiet about climate – even after the Florida hurricanes –
  • remaining muleishly pro-Israel, to the extent that Bill Clinton, campaigning in Michegan, argued that the Palestinians had it coming because they didn’t agree to the bantustan he proposed at Camp David, proved incapable of holding the base they had in 2020.

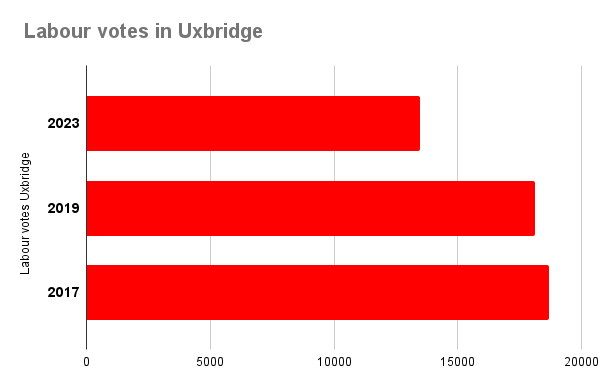
This parallels the experience of the UK Labour Party, which has relentlessly carried out the same orientation since Keir Starmer was elected leader, with the result that Labour amassed half a million votes fewer in the General Election this year than in 2019 (down from 10.2 million to 9.7 million) only managing to get a huge majority in the House of Commons because the Conservatives had presided over a decline in livings standards even greater than that in the US over the same period, and the right wing vote, for the first time in modern history, was split right down the middle between the Tories and Reform; putting this governmnet too on very thin ice – as local council by elections are showing sharply.

The core lesson for the UK is that an incumbent government that proves incapable of at least maintaining living standards is going to be kicked out. “Its the economy, stupid”.

Labour Votes in Uxbridge, Selby and Ainsty down on 2017

Before anyone gets any impression that the Selby by election represents a mass move endorsement of Labour’s current attempt to drift into office on the back of Conservative unpopularity, all of the by elections on July 20th should provide food for thought.

Selby has been presented as the clearest evidence of a potential landslide, and much made of the swing from Tory to Labour. When you look at actual voters, however, its clear that there is no massive surge of Labour support, with a slight increase on the votes achieved in the bleak midwinter of 2019, but a drop from the high watermark of Corbynism in 2017. This indicates that Labour was able to mobilise some of its core vote in this constituency, but not all of it.

The swing is accounted for by the collapse of the Tory vote, from 33,995 in 2019 to 12,295 this week. A drop of almost two thirds.

A further indication that it is antipathy to the Tories that is driving these results rather than positive support for Labour is show by the votes in Somerset and Frome, where the Conservative vote also plummeted by two thirds, from 33,231 to 10,179.

Its quite clear that most of Labour’s previous voters in this constituency voted for the Lib Dems, whose 13,325 voters in 2017 were barely 3% ahead of Labour’s 10,998. The Labour vote is now less than a tenth of what it was then and is now a quarter of the vote achieved by the Greens, whose vote doubled.

In Uxbridge, the Labour vote was down about a quarter on both 2017 and 2019 from over 18,000 in both years to 13,470.

The Conservative vote, however, dropped by a “only” a half from 25,351 to 13,965. If this is the straw of comfort that the Conservatives are grasping at, it shows how desperate their situation is.

The notion, now being energetically pushed by the Labour leadership, that the Uxbridge result shows the need to back off from any policy that might scare off current Conservative voters is belied by the utter failure to motivate and mobilise Labour’s potential vote in these constituencies. The stances taken on issues like the two child cap on child benefit, that led to the moniker “Sir Kid Starver” circulating all across social media, will hardly have driven our people to the polls with any enthusiasm.

And, as for the ULEZ, this post from Open Democracy indicates that it was the failure to fight for it that was one of the factors that kept potential Labour supporters at home, the opposite of the conclusion that the Party leadership is so eager to draw. As they put it.

…Russell Warfield, a campaigner with the environmental group Possible says – is that there is a “hardened rump” of Conservative, anti-ULEZ, pro-car voters in the outer-London boroughs. And we already knew that: polling shows that, while a majority of Londoners back ULEZ expansion, most Tories oppose it.

Specific polling in a group of London boroughs where councils are taking legal action against Sadiq Khan over the scheme – including Hillingdon, which overlaps with Uxbridge and South Ruislip – found a majority of people in these areas who are deeply concerned about air pollution. (My emphasis)

Just as there is a block of anti-ULEZ people capable of being mobilised by the Tories, there is a group of pro-ULEZ people that Labour could have mobilised had they tried. But instead, the party’s candidate came out against the scheme, Starmer sat on the fence, and the potential Labour voters sat at home.

When they say there is no money…

Health Secretary Steve Barclay says the Junior Doctor’s claim to restore their salary levels to where they were in 2008 are “unaffordable” he does so in a tone of voice that is almost bewildered in its puzzlement that anyone could possibly think that their work should be valued as highly as it was 15 years ago. No one in the media seems to have the gumption to ask Barclay, or other Minsters saying the same thing, what has gone so badly wrong on the Tories watch that so many people are so much worse off now than they were before they came to power.

All the same, Barclay’s claim should be examined in relation to the cost of the Junior Doctors claim in full would cost £1.08 billion.

This is just under the £1.1 billion the Chancellor handed out with no apparent stress at all as tax relief for the most lucrative private pension pots. A straight hand out to the top 1%.

Its is just over a fifth of the £5 billion he handed out to the Ministry of Defence for extra military spending; which we’d better hope is wasted, because if its used its deadly.

And a ninth of the £9 billion in Tax relief to companies making investments; which is also a straight hand out with no effect, as incentive loop holes like this never lead to additional investment, just to the companies in receipt of them paying for the investment they were going to make anyway courtesy of foregone investment in more useful things by the state.

So, there is money, but they are spending it on the wrong people. Visually, that looks like this.

Shifting Sources of power generation in the OECD

The annual figures produced by the IEA on the OECD countries are a useful gauge of shifting sources of power generation. The OECD is made up of all the world’s richest countries; all of North America plus Columbia and Chile in South America, most of Europe, Japan, Korea, Australia and Turkiye.

Overall, between November 2021 and November 2022, fossil fuels still accounted for over half of all power generated, with renewables now up to just over a third and nuclear down to a sixth.

But, between November 2021 and November 2022 there has been a growth in the use of renewable sources of energy and a decline in the use of fossil fuels and nuclear.

Within fossil fuels coal and natural gas have both declined by about the same amount.

Within renewables there has been a dramatic increase in solar and a smaller but steady increase in wind.

The International Energy Agency has projected that 90% of new energy generation will be renewable by 2025. With the IPCC warning that 1.5C is slipping beyond our grasp unless we accelerate this trend sharply there should be no holding back on getting to 100% and eating into those big residual fossil fuel slices.

Four caveats

  1. These figures are just for the generation of electricity. This is a vital area, but fossil fuels are also in use for domestic heating and cooking (78% of homes in UK have gas central heating) transport and manufacturing. Energy generation has made faster progress towards sustainability than other sectors. Transport emissions in the UK, for example, have made no progress for over a decade.
  2. These are figures from the OECD. OECD countries are primarily those with high per capita climate footprints and the huge legacy of having generated the overwhelming majority of the carbon emissions that have led to the temperature rises we have seen to date. This is therefore not a full picture of the Global sources of energy use as it misses out most of the Global South. China has a large legacy use of fossil fuels but is investing in renewables on a significantly greater scale than the OECD.
  3. The OECD also has the capital and technical wherewithal to invest in renewable energy; but are denying this for the most part to the Global South, which is being impacted harder and deeper. On average African countries are already losing 5-15% of GDP a year due to adverse climate impacts, so having to run harder and harder to stand still. Global South countries are charged far higher rates of interest by banks if they want to borrow to invest in energy transition than Global North countries, which makes it hard for them to do so without being caught in a debt trap.
  4. The Global South, for the most part, has a very high proportion of traditional renewable energy (Hydroelectric dams) so the transfer of capital and technical expertise is vital for them to develop without reliance on fossil fuels. The decision by China to stop all coal power funding as part of Belt and Road is a huge positive step. The decision by the EU to classify gas as a transition fuel and encourage a “dash for gas” in Africa (to make up for the loss of Russian supply) is a step backwards.

Tiny Tipping Points as China pulls ahead.

Although China has a nominal per capita income of just under a third of the US level in 2022 in PPP terms; since 2020 it has began to overhaul the US as a society in some key respects.

Life expectancy in China now exceeds that of the US by 20 months; at 78.2 years to the American 76.6. This might be dented this year by the current rise in COVID infections, but current indications are that the Zero Covid policy kept the population safe during the most lethal period, so the impact of opening up now will be qualitatively less than it was in the West.

In China, infant mortality has declined to 5 per 100,000, now below the US level of 5.5 and the maternal death rate at birth is now substantially lower, at 16 per 100,000, compared to 24 per 100,000 for the US.

While this is improving but uneven in both countries, the rate of improvement is greater in China.

  • In the worst performing US State, Mississippi, infant mortality declined slightly from 10.1 per 100,000 in 2009 to 8.7 per 100,000 in 2019.
  • While in Louisiana in 2021 the maternal death rate was 58.1 per 100,000 births.
  • This compares unfavourably with Xinjiang, one of China’s least developed and poorest regions, where infant mortality dropped dramatically from 26.58 per 1,000 in 2010 to 6.75 per 1,000 in 2020.
  • At the same time, the maternal death rate more than halved from 43.41 per 100,000 in 2010 to 17.89 per 100,000 in 2020 – less than a third the Louisiana rate.

NB the figure for Louisiana is for 2021, that for Xinjiang is for 2020.

Beneath the brute figures of sheer size of economies – China’s has been larger in PPP terms since 2014 and is likely to be bigger in exchange rate terms by the late 2020’s – China’s largest firms are beginning to outperform those of the USA, with Chinese companies in the Fortune 500 Global list earning $11.71 Trillion last year, compared to $11.34 trillion for the US companies listed. 87 out of the 145 Chinese companies listed are majority, or wholly, state owned.

This is underpinned by increasingly ground breaking scientific research, with the Chinese share of the most cited Scientific papers (top 1%) having grown to 27.2%, surpassing the USA’s 24.9%.

The US model of development, dependent as it is on dominating and exploiting the rest of the planet, producing consumption patterns with an elephantine carbon footprint, is neither a viable path for other countries to follow – because no other country can dominate the way that it does – nor, as we can see above, does it produce the best possible outcomes for its population from the resources it commands. It is already an outmoded model of modernity.

Figures from Dongsheng News

Plenty of money for war. Token gestures for climate.

Faced with a collapsing climate, the most powerful country on the planet is spending colossal sums of money on keeping the war in Ukraine going rather than seeking a peace, while only committing to a tenth of its $11 billion pledge to the Global South for funding to avert climate breakdown.

These figures show a set of priorities that spell disaster for humanity unless reversed.

Figures for military aid to Ukraine here.

Figures for climate funding for global south here.

US v China military and green transition spending

There is no way to dress this up. If you look at the figures for investment in military spending as a ratio of investment in domestic green transition it becomes obvious what each country’s priorities are.

The agreed US military budget for 2023 is $858 billion. The investment in green transition earmarked by the Inflation Reduction Act is $369 billion between now and 2030. So, 858 multiplied by 8 years gives a total spend of $6864 billion by 2030. Divide that by the 369 billion to be invested in green transition and you get a ratio of 18.6:1. So, for every dollar spent on green transition in the United States, $18.60 is spent on the armed forces.

China’s military budget for 2022 was $229 billion, according to Jane’s. The investment earmarked for green transition – for a carbon peak before 2030 and neutrality by 2060 – is $450 – 570 billion a year, according to China Briefing. That gives a ratio of between just under 2:1 and 2.5:1, so on average more than twice as much being invested in green transition as on the military.

So, the US, eighteen times as much on the military. China, twice as much on greening. It’s quite obvious from this which country’s investment is more beneficial to the world making a viable transition to sustainability.

These calculations assume flat military budgets. An additional reason that none of us can afford the new cold war that the US is determined to pursue is that China will be forced to devote more resources to defence, which will slow the transition. A reduced US military budget, on the other hand, would allow both countries to transition quicker and allow greater cooperation to that end.

How Americans see the War in Ukraine

Following on from the information that 77% of Germans support the West initiating peace negotiations in Ukraine, a survey published by the Quincy Institute for Responsible Statecraft and Data for Progress shows that 57% of likely American voters support the US pursuing diplomatic negotiations as soon as possible to end the war, even if it requires Ukraine making compromises with Russia. 

More people think that the Biden Administration should do more to initiate peace talks than think it has done enough.

More people think that continuing US military aid – amounting to $53 Billion so far with another $12 Billion under discussion – should be not continue unless there is ongoing diplomacy to end the war than those who think it should be unconditional.

There is a similar level of opposition to continuing support at current levels if this leads to long term global and US economic hardship.

This is made even stronger when specific examples of domestic hardship are identified, with a strong majority opposing continued support at current levels if it leads to increases in gas (petrol) and good prices in the US.

Trita Parsi, executive vice president at the Quincy Institute, put it rather well, “Americans recognize what many in Washington don’t: Russia’s war in Ukraine is more likely to end at the negotiating table than on the battlefield. And there is a brewing skepticism of Washington’s approach to this war, which has been heavy on tough talk and military aid, but light on diplomatic strategy and engagement.

‘As long as it takes’ isn’t a strategy, it’s a recipe for years of disastrous and destructive war — conflict that will likely bring us no closer to the goal of securing a prosperous, independent Ukraine. US leaders need to show their work: explain to the American people how you plan to use your considerable diplomatic leverage to bring this war to an end.” 

It should also be noted that only 6% considered that the war in Ukraine is a top 3 issue for the US, with 94% disagreeing.

How Germans see the war in Ukraine

In a survey conducted recently by opinion research institute Forsa for the RTL / ntv “Trend barometer” there are very strong majorities for “the West” to initiate peace negotiations (Graph 1) for “Western leaders” to keep talking to Russian President Putin (Graph 2).

While there is majority support for supporting Ukraine at least at the current level about a quarter of people think that it is too much, balancing similar numbers who think it too little (graph 3) but there is equally strong opposition to specific escalation (graph 4).

Opinion in the UK – with less dependence on Russian gas and a bigger role for the military in its national psyche – is more bellicose, but the strong sentiment for the sort of peace negotiations that China and India have called for in the key state in the EU indicates that its government will face increasing difficulties in maintaining a pro war stance as the winter crisis unravels.

Stats for Socialists: Wages and Inflation

The government argues that wages should decline in value, because if they don’t, prices will go up.

There are six countries in the EU that have a system whereby wages are automatically increased to catch up with inflation every six months.

Their inflation rates in July were no worse than those in comparable countries.

Indexed countries in capitals

Looking at neighbouring countries, we can see here that Belgium, where the employers have a campaign to get rid of indexation as “unsupportable”, has a lower inflation rate than The Netherlands, which doesn’t have it, Slovenia, which has indexation, has a lower rate of inflation than Croatia, which does not.

And the UK has a higher rate of inflation than five out of six of the indexed countries, with only Slovenia being higher.

Workers are the victims of inflation, not the cause.